One screen for how you actually run your printers
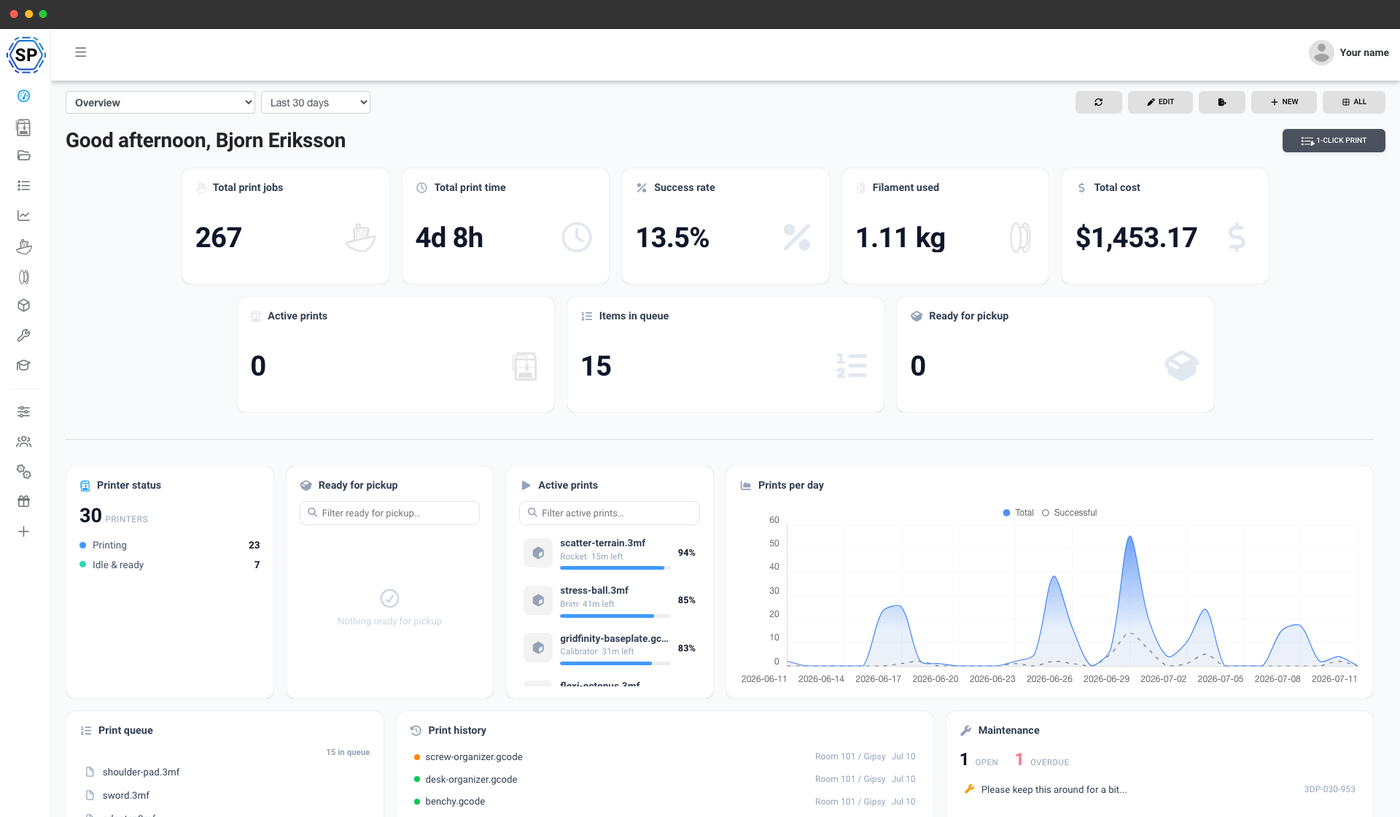
Every farm, lab and workshop runs differently. Custom dashboards let you assemble the exact overview your team needs - a wall-mounted farm status board, a manager's statistics view, a student landing page - without waiting on a developer. Cards pull live data from the same platform you already use, so a dashboard is never out of date.
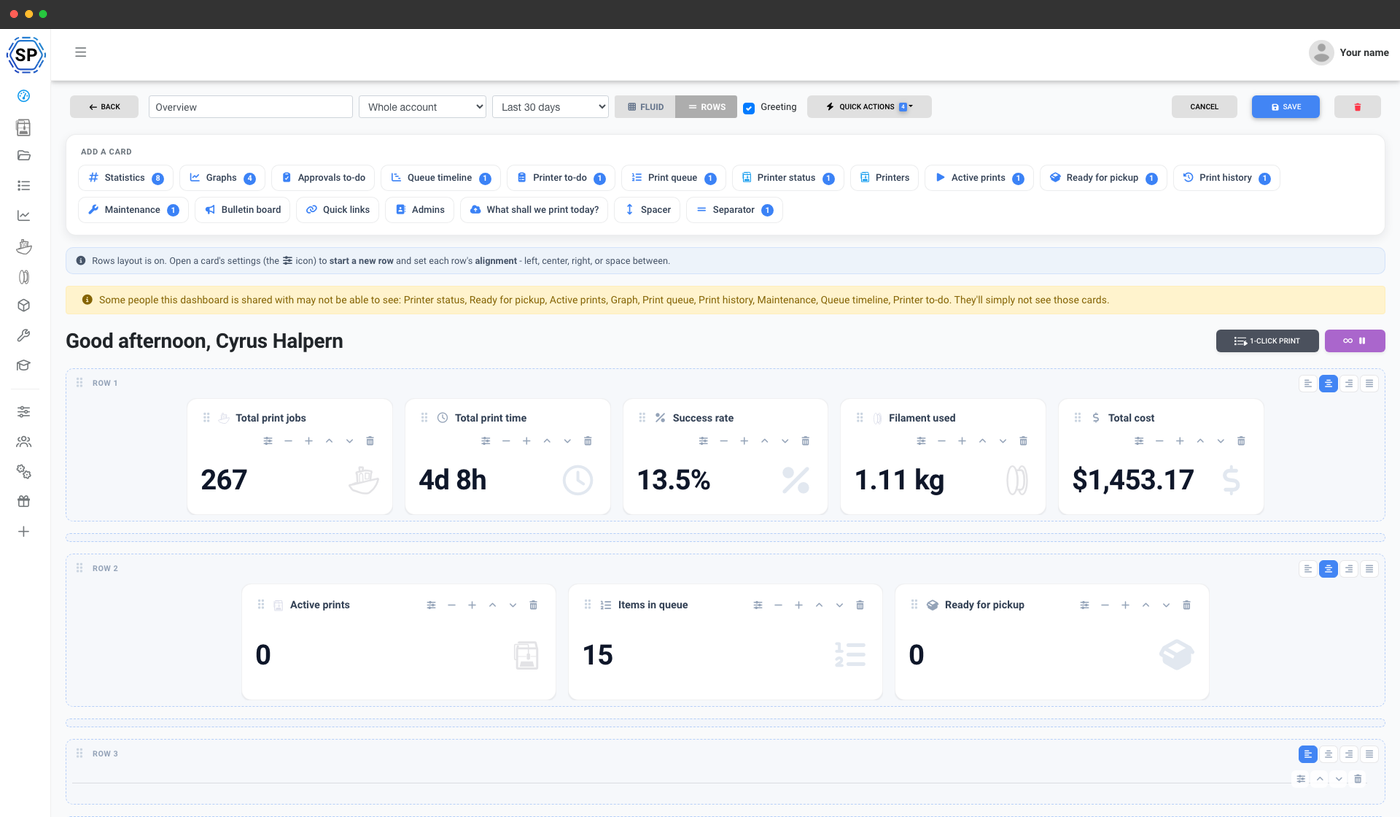
Compose a dashboard from cards, no code required
Open the builder, pick the cards you want, and drag them onto a grid. Resize a card to make the queue bigger and the stats smaller, drop in a spacer or separator to group things, and reorder everything until the layout matches how your team works.
You are not locked into one template. Start from a sensible default, then add, remove and rearrange cards whenever your workflow changes. Managing dashboards is a permission, so you decide who on your account can build and edit them.
Cards for every part of your operation
Each card is a self-contained widget that pulls live data from the platform. Mix and match to build the view you need:
- Printer status and a live printer embed (the same fleet view as the printers page), so a wall display shows what every machine is doing right now
- Active prints and ready for pickup, to see what's running and what's finished
- Print queue as a list or full table, plus the queue timeline
- Statistics number tiles (total prints, print time, success rate, filament used and more) and statistics graphs (prints per day, job outcomes, per-printer breakdowns)
- Maintenance, so upcoming and overdue tasks surface on the same screen as your printers
- Print history of recent jobs (as a list or full table)
- Quick links, a bulletin board, an admin directory and a file upload zone for a self-serve landing page

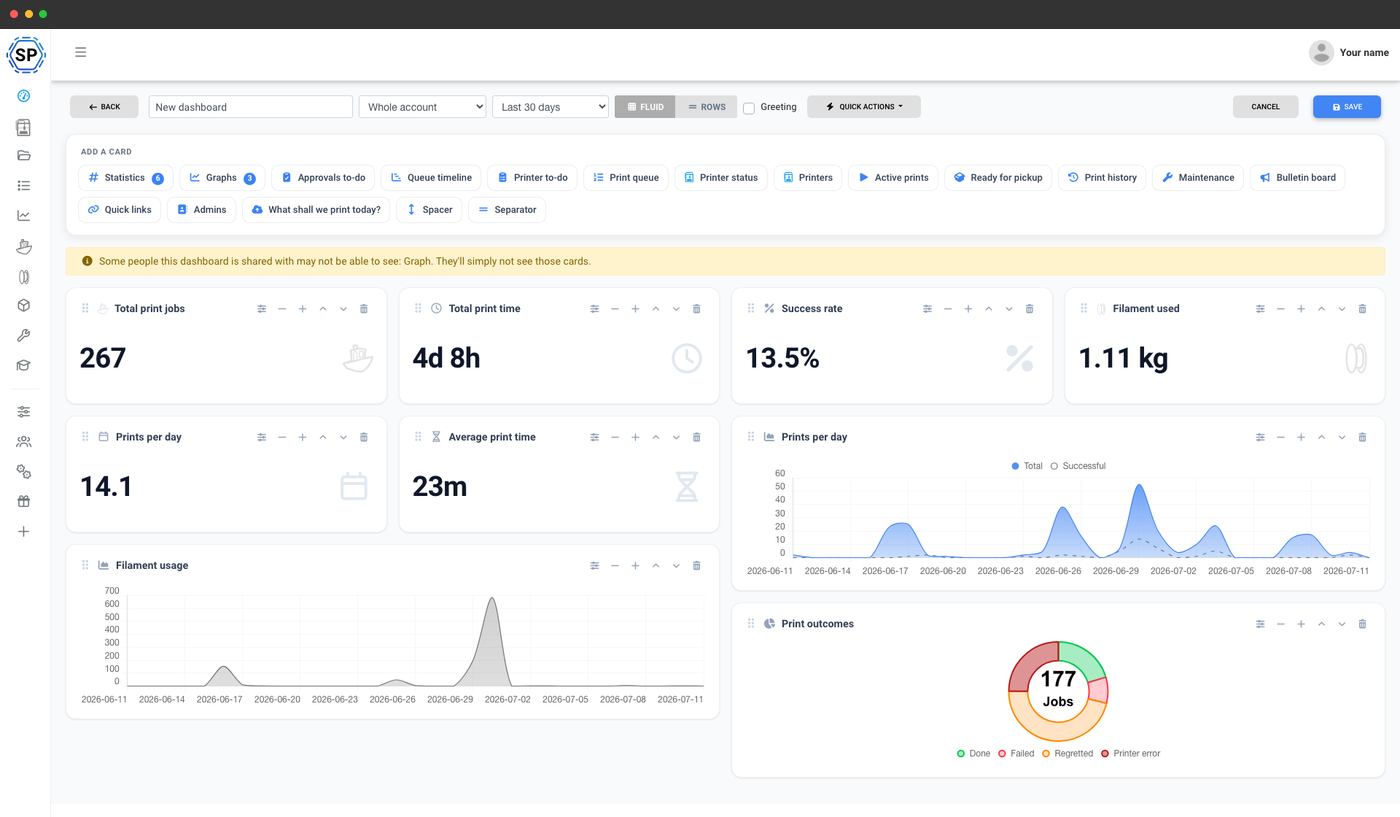
Put the numbers that matter front and centre
Drop in a row of number tiles for the headline figures - total prints, print time, success rate, filament used, run time, cost - and add graph cards for the trends: prints per day, job outcomes as a doughnut, and a stacked bar of status per printer.
Set the time period per statistics card (last 7 days, a rolling window, an exact date range, or all time) so a manager's overview and a shift board can live side by side. Pair it with our statistics feature for the full picture.
Built for farms, schools and enterprise teams
The same builder serves very different rooms. Assemble the dashboard that fits yours.
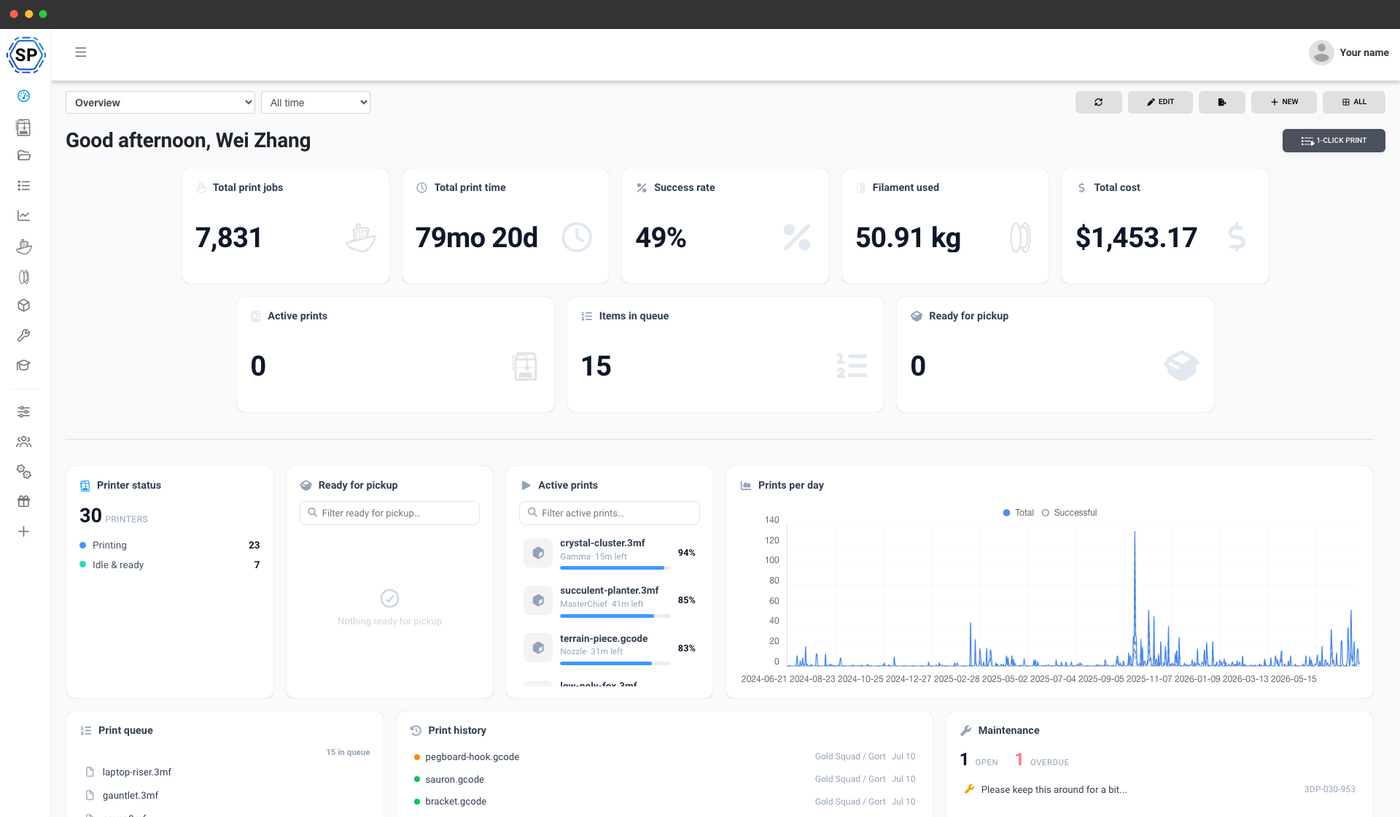
A wall board of printer status, the queue and daily output.
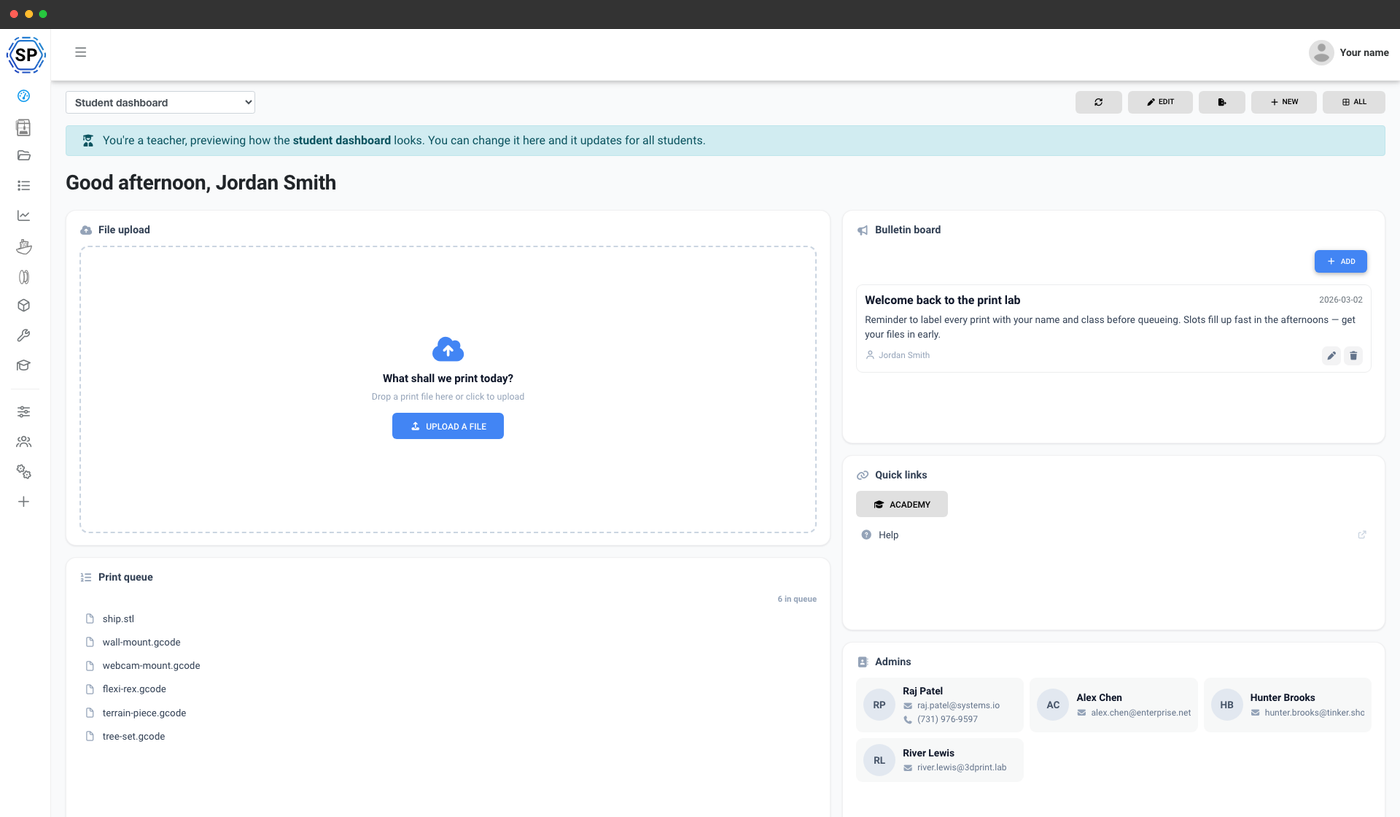
A student landing page with upload, queue and a bulletin.
Unlimited dashboards, shared with specific people.

Share the right view with the right people
A dashboard doesn't have to be private. Keep it to yourself, publish it to your whole account, or share it with specific user groups - so operators, managers and students each get a dashboard shaped for them.
On Enterprise, you can go one step further and share a dashboard with named individuals, not just groups. A user who can view several dashboards gets a simple switcher to move between them.
Ready to build your own overview?
Add your printers, open the dashboard builder, and drag in the cards your team actually needs.
Start your free trialPlan access: which plans include custom dashboards?
Custom dashboards are part of the Print Farm plan and are inherited by School and Enterprise. Each plan sets how many dashboards you can build, and Enterprise removes the limit and adds sharing with specific people.
| Feature / Limit | Free | Basic | Pro | Print Farm | Enterprise | School | Cloud Slicer | Filament Manager |
|---|---|---|---|---|---|---|---|---|
|
Custom dashboards
The builder and the full standard card set, plus sharing with your whole account or specific user groups. Print Farm includes 3 dashboards and School includes 5 (the reserved student and teacher dashboards don't count towards that).
|
||||||||
|
Advanced dashboards
Enterprise only: unlimited dashboards and the ability to share a dashboard with specific people, not just user groups.
|
Want to learn more about our plans?
View full pricing & feature comparisonFrequently asked questions
What is a custom dashboard in SimplyPrint?
What cards can I add to a dashboard?
How many dashboards can I create?
Can I share a dashboard with my team?
Can I put statistics and graphs on a dashboard?
Who can build and edit dashboards?
Do students and teachers get their own dashboard?
What if my plan doesn't include custom dashboards?
Which plan includes custom dashboards?
Running a classroom instead of a farm?
Schools get a ready-made pair of role-aware dashboards on top of the custom builder: a teacher control centre with approvals and quota requests, and a clean student landing page with upload, queue and a bulletin board. Both are reserved dashboards that don't count against your custom-dashboard limit.
See teacher & student dashboards