From a single hobbyist printer to a 100-printer farm
Whether you're measuring how often your home printer succeeds, reporting fleet throughput to a manager, or showing usage per student at the end of a semester, the statistics page works at every scale. Same data, same charts, just filtered to whatever scope you need.
One page, every headline number, every chart at a glance
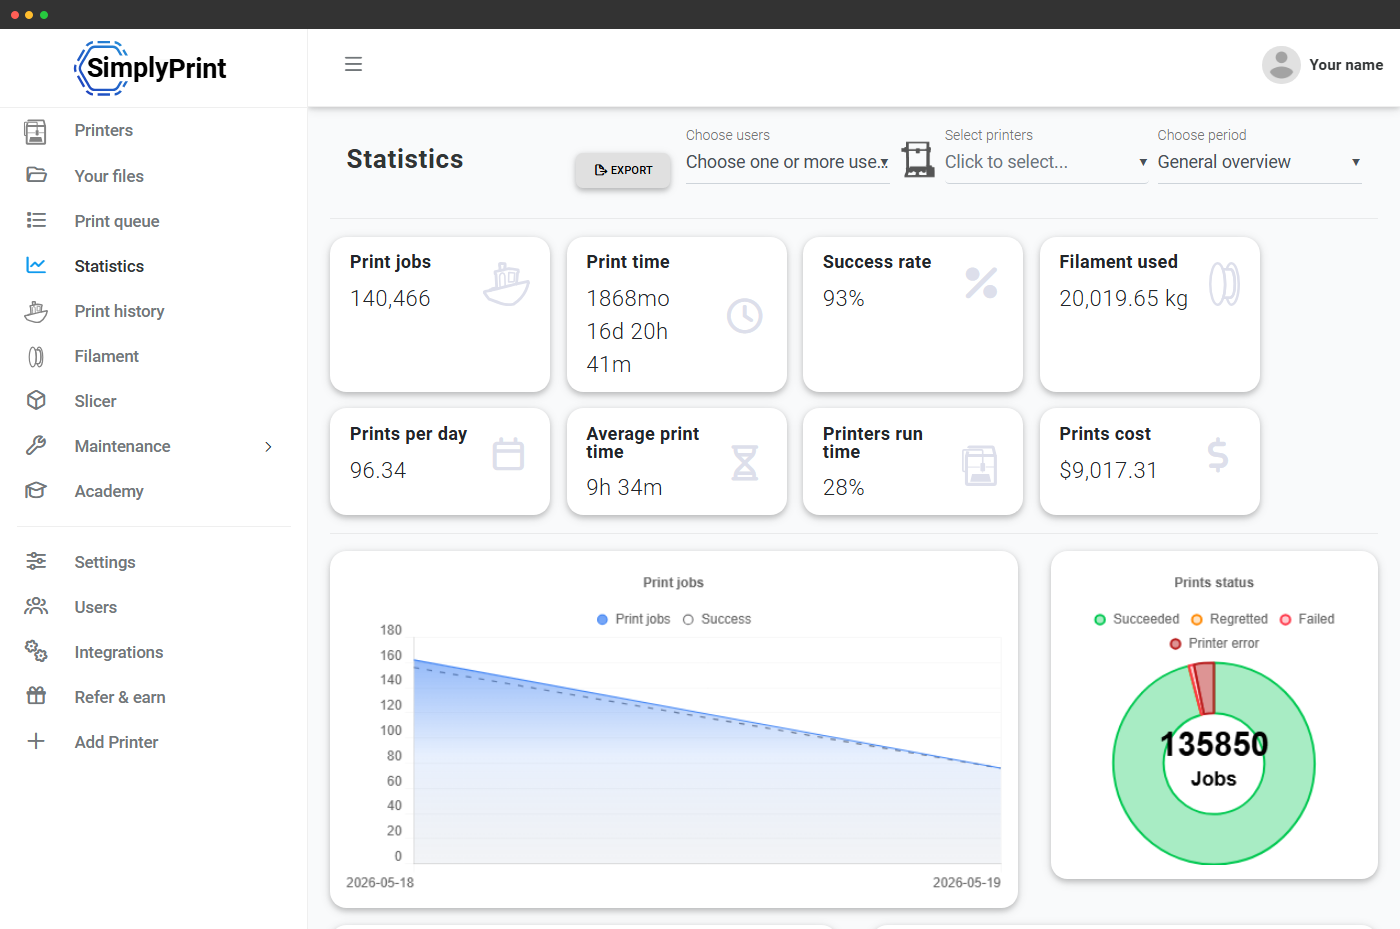
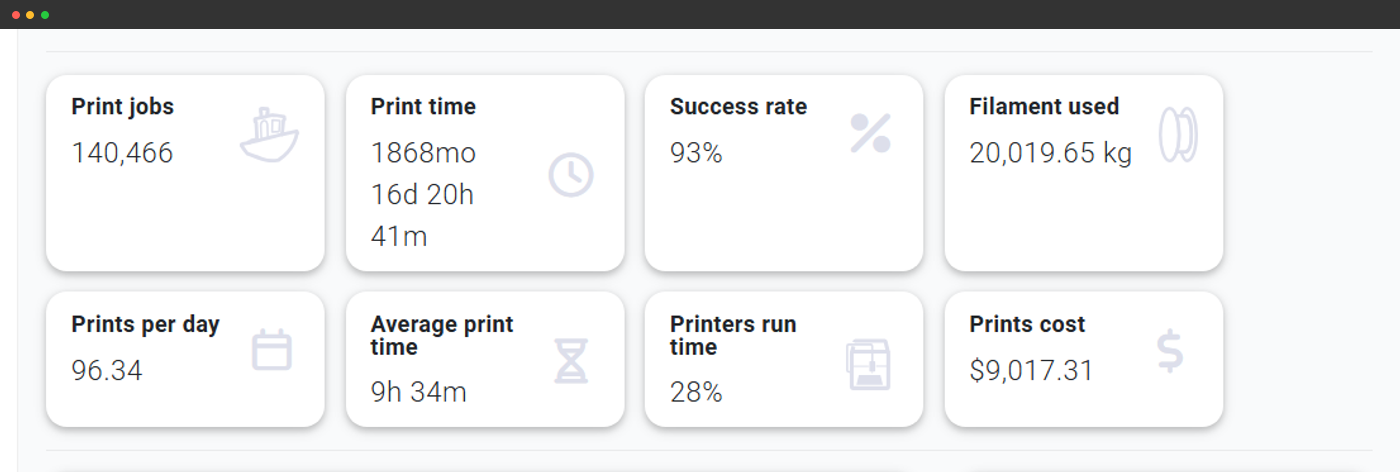
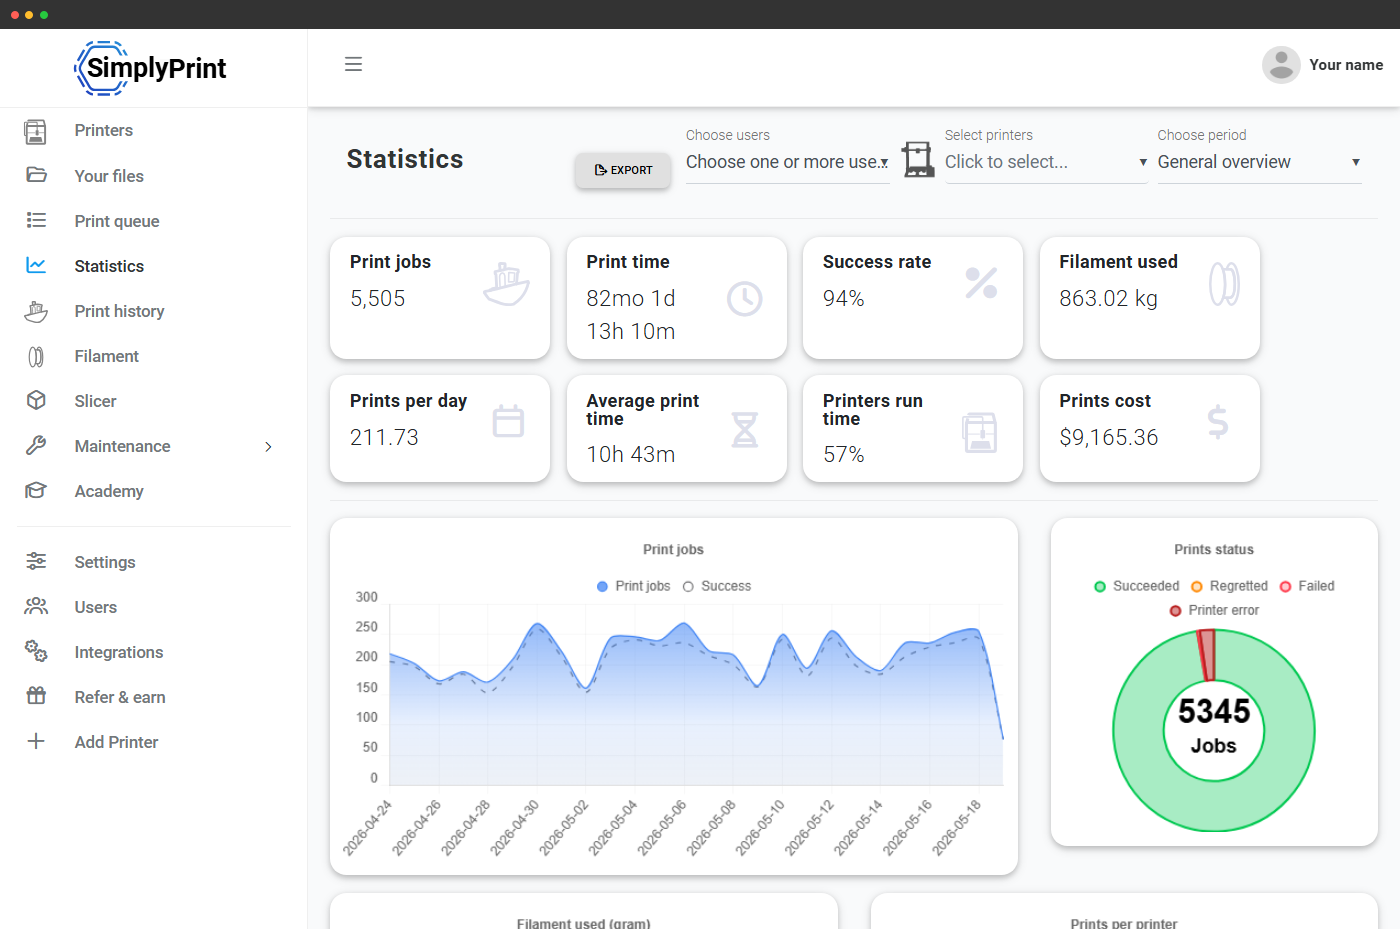
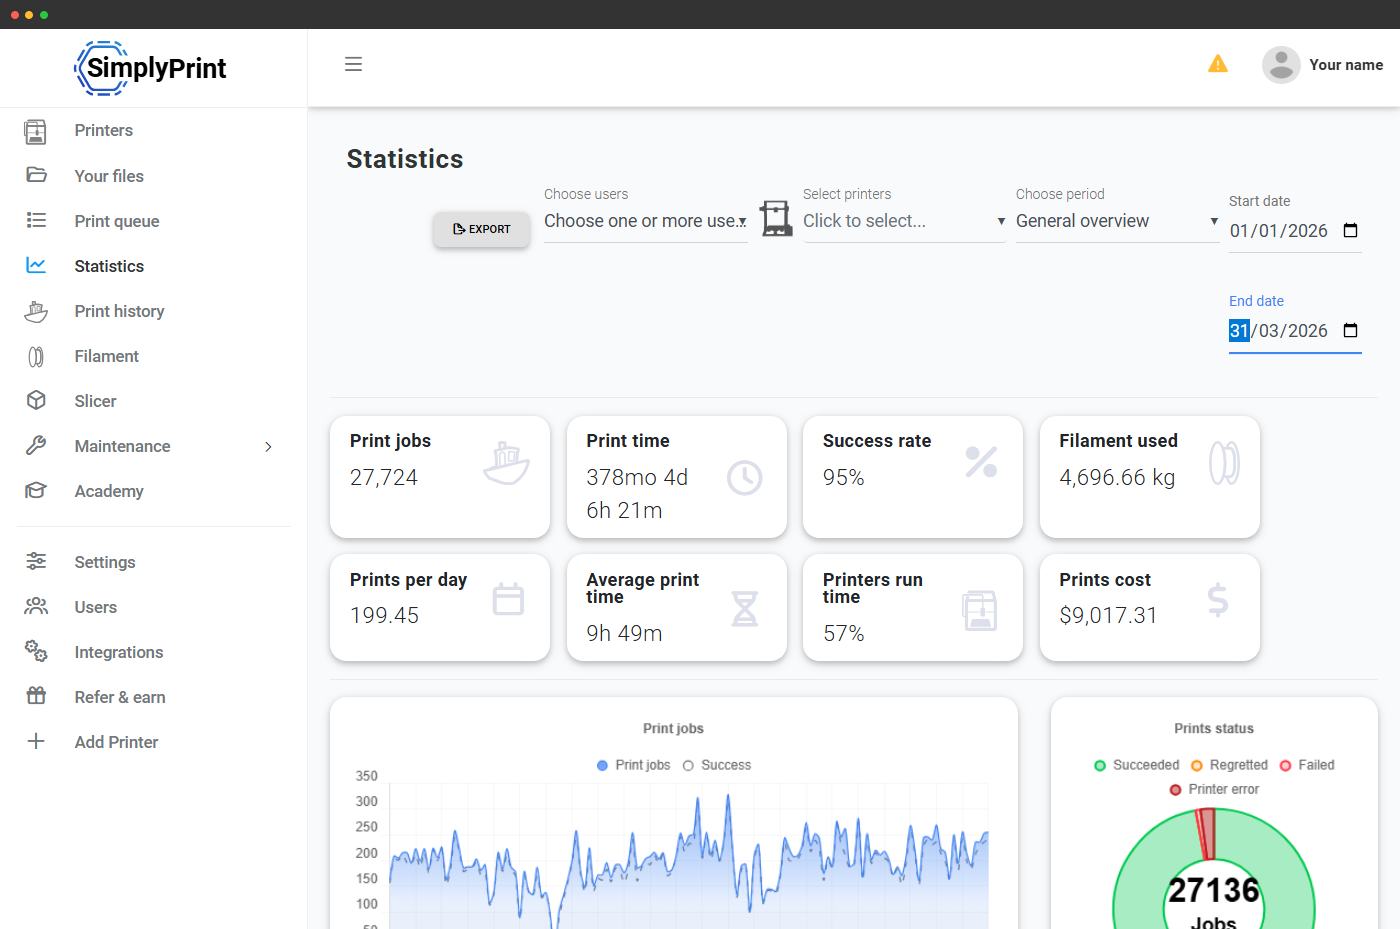
Open Statistics and you immediately see a row of summary cards across the top - total print jobs, total print time, success rate, filament used, prints per day, average print time, printer run-time and total cost - followed by a grid of charts that visualize the same data over time and across machines.
Every card and chart obeys the active filter set, so changing the date range, the selected printers or the selected users updates the whole page at once. No drilling, no separate reports.
Summary cards that answer the questions you actually ask
Every card is a single number, large and unmissable, so you can answer the obvious questions in a glance:
- Print jobs - total completed plus ongoing prints in the window
- Print time - cumulative print seconds, rendered as months / days / hours / minutes
- Success rate - completed prints as a percentage of all jobs
- Filament used - total grams consumed, rolled up to kilograms when large
- Prints per day - average completed jobs per day in the window
- Average print time - mean per-job duration
- Printers run time - share of observed time printers were actively printing
- Prints cost - sum of per-job cost in your account's currency
Doubled effective capacity, without buying a single new printer
Print farms running SimplyPrint typically report doubled effective capacity within the first quarter - not because the printers got faster, but because Statistics shows you which printers are sitting idle, which jobs failed silently, and where your real bottlenecks live. Same hardware, same operators, twice the throughput - because you can finally see what your fleet is actually doing.
Cost per print is the number that turns hardware into a P&L
Cost per print is the single number that converts "we have printers" into "we have a P&L". Statistics breaks it down per printer, per filament type, per customer (when you tag jobs with custom fields). Once you know what each print actually costs, quoting stops being guesswork and pricing decisions stop being arguments.
Charts that turn data into decisions
Below the cards, a grid of charts visualizes the same window from different angles. Each one is a self-contained card you can read at a glance, and they all re-render the instant you change a filter.
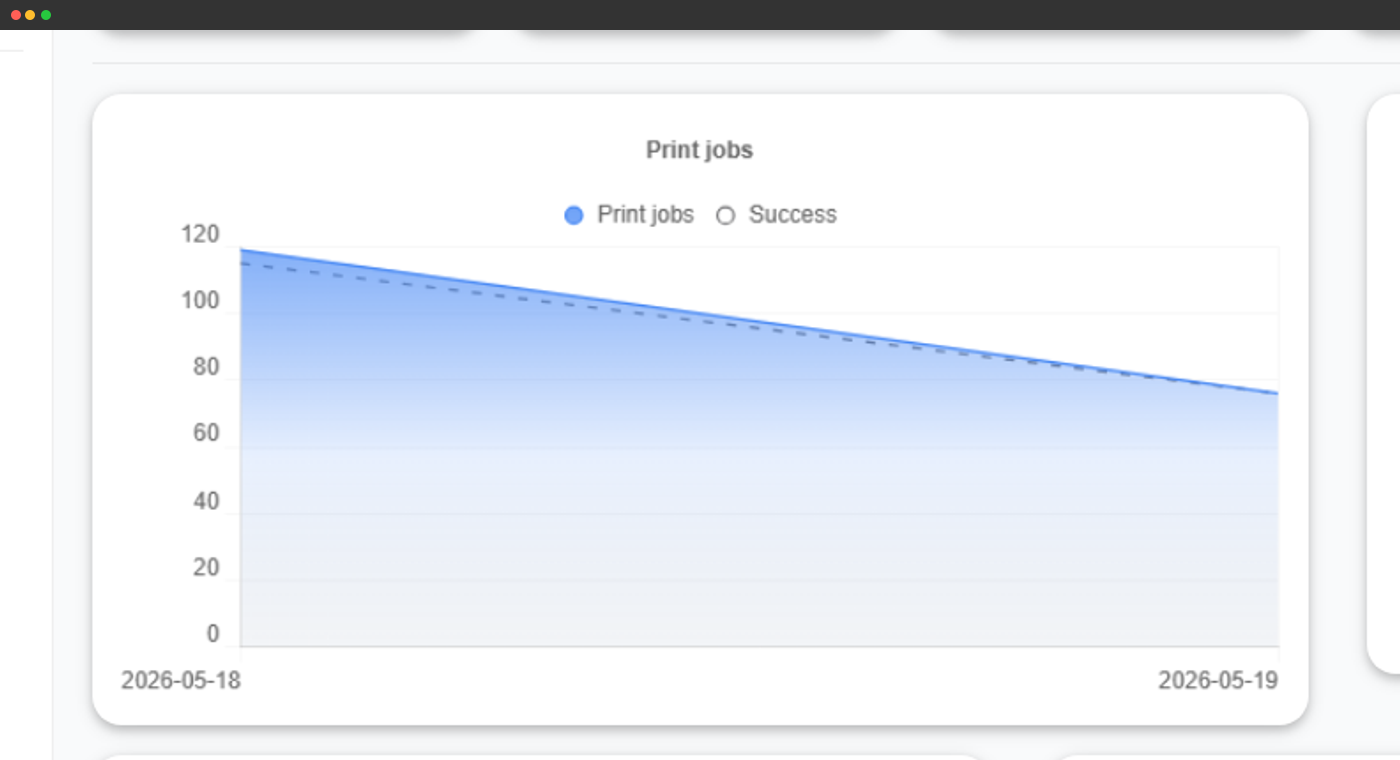
Daily completed jobs with a success line over time.
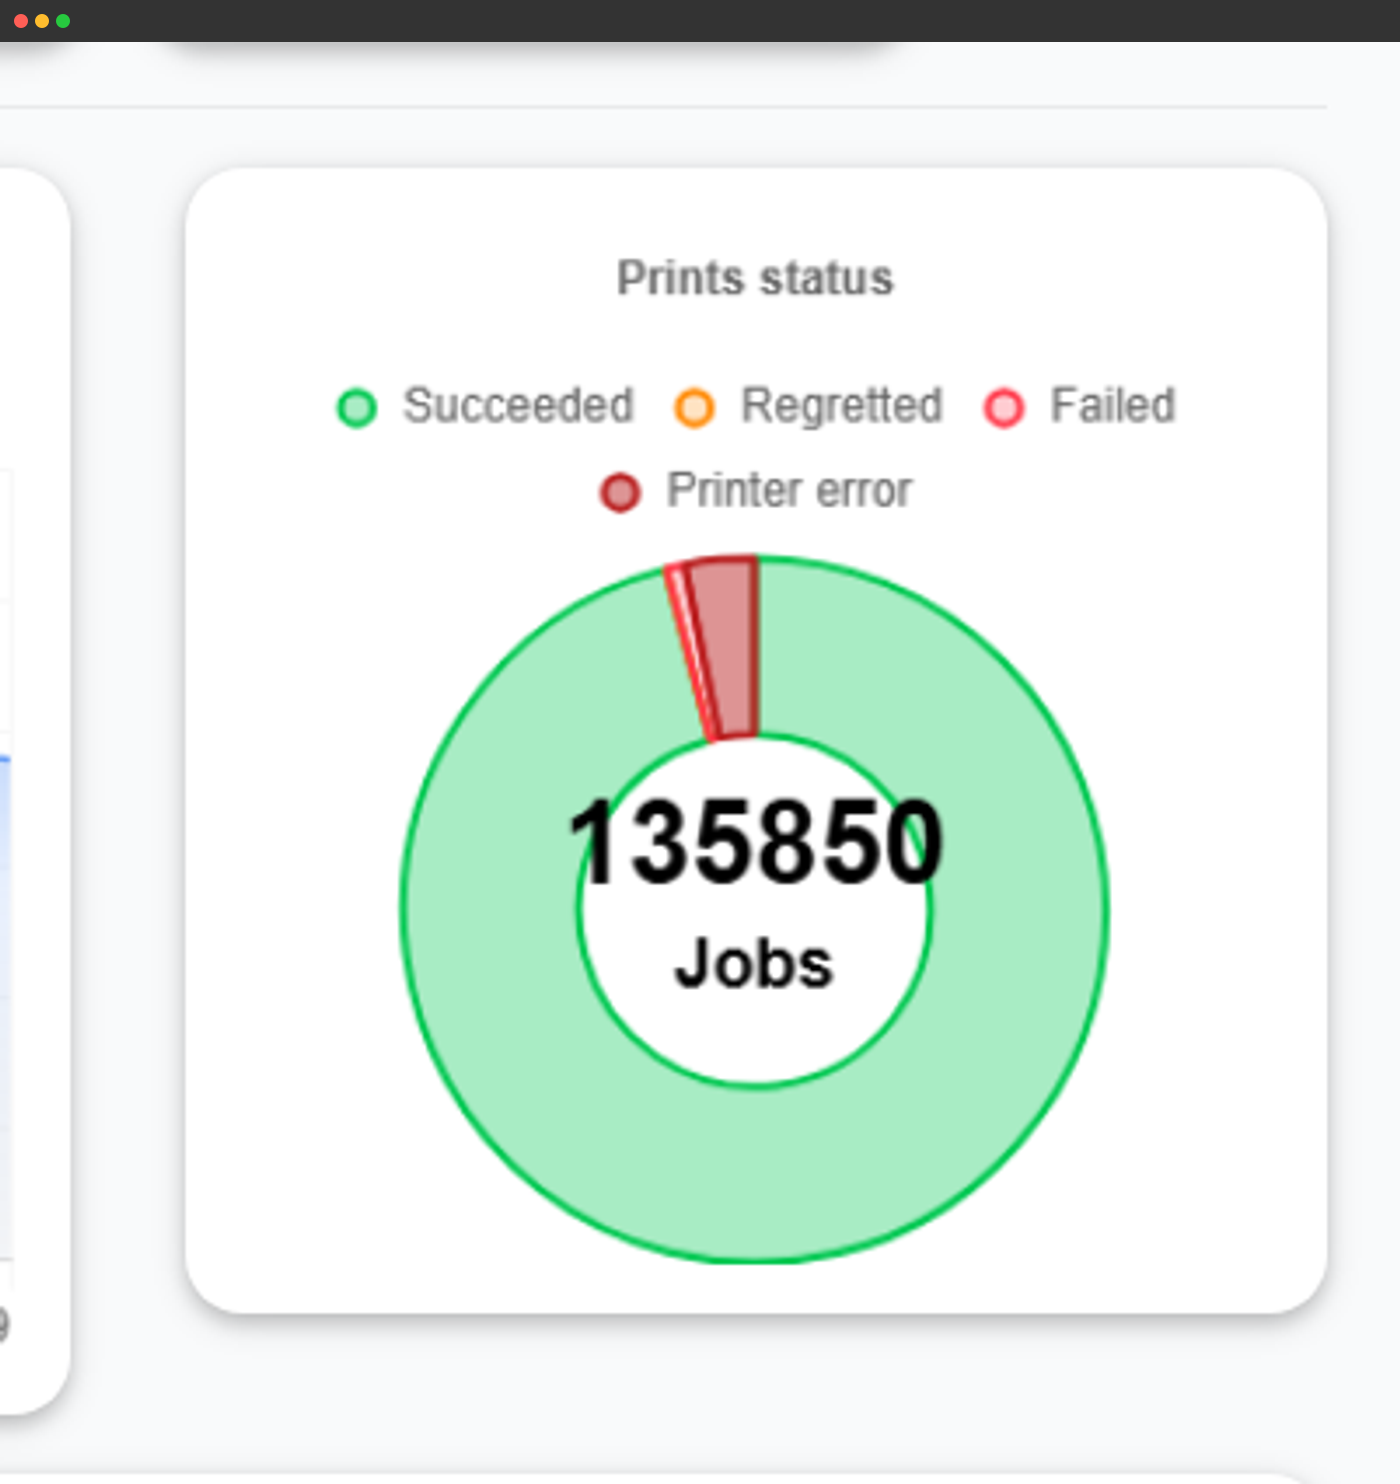
Doughnut of outcomes: succeeded, regretted, failed, printer error.
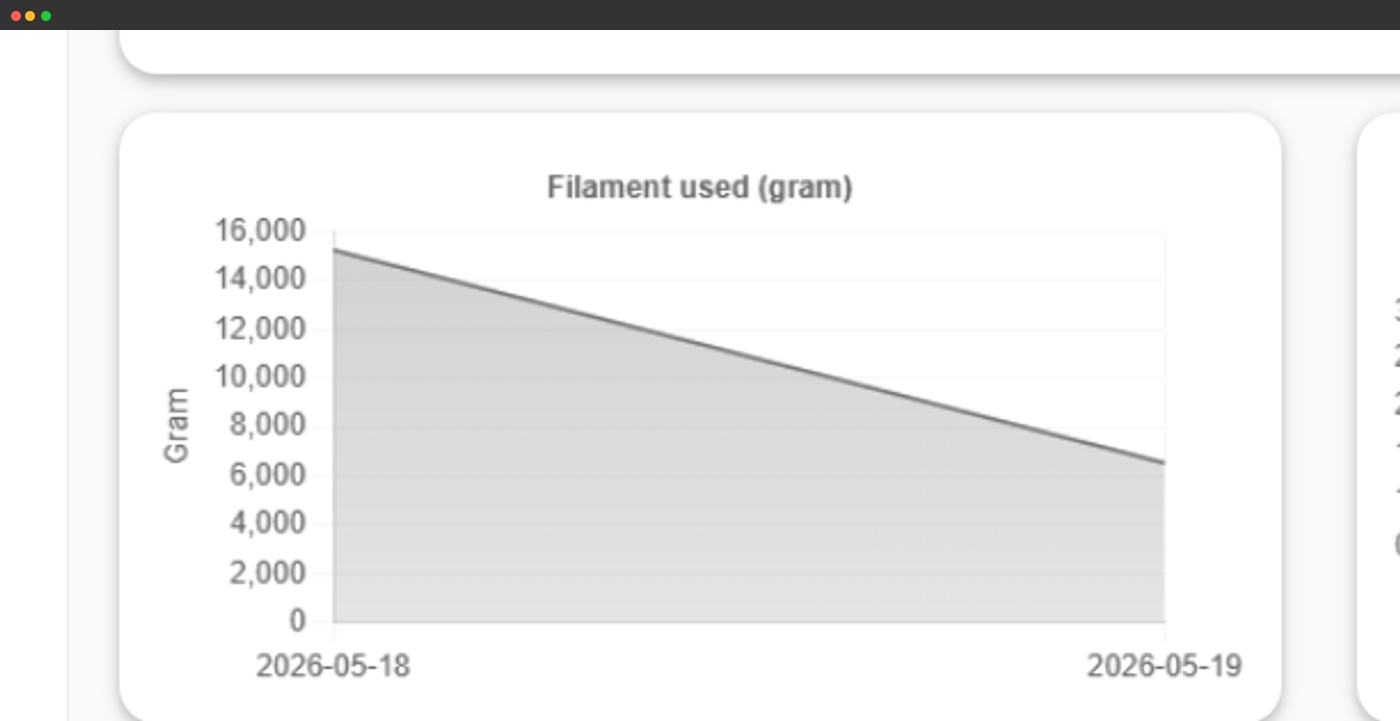
Daily filament consumption in grams for forecasting orders.
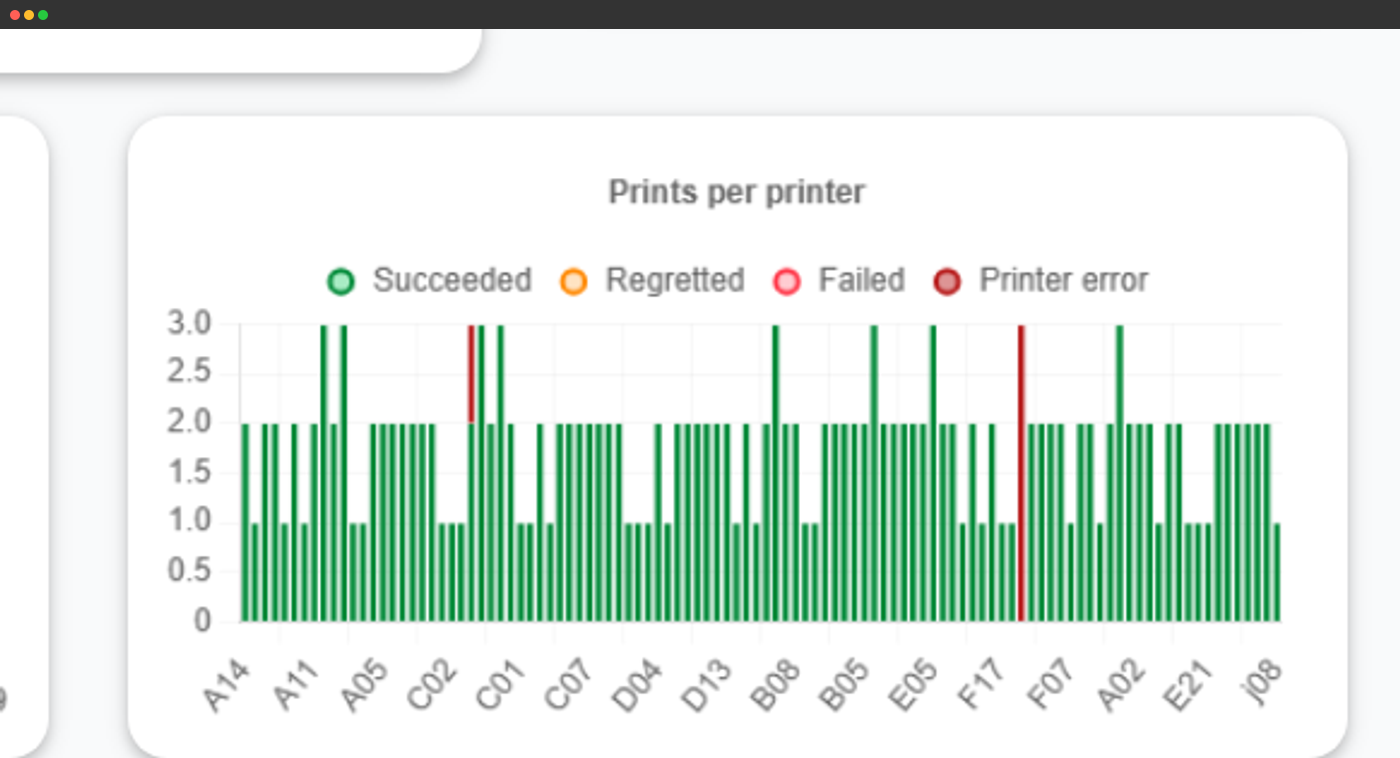
Completed prints per printer, coloured by outcome.
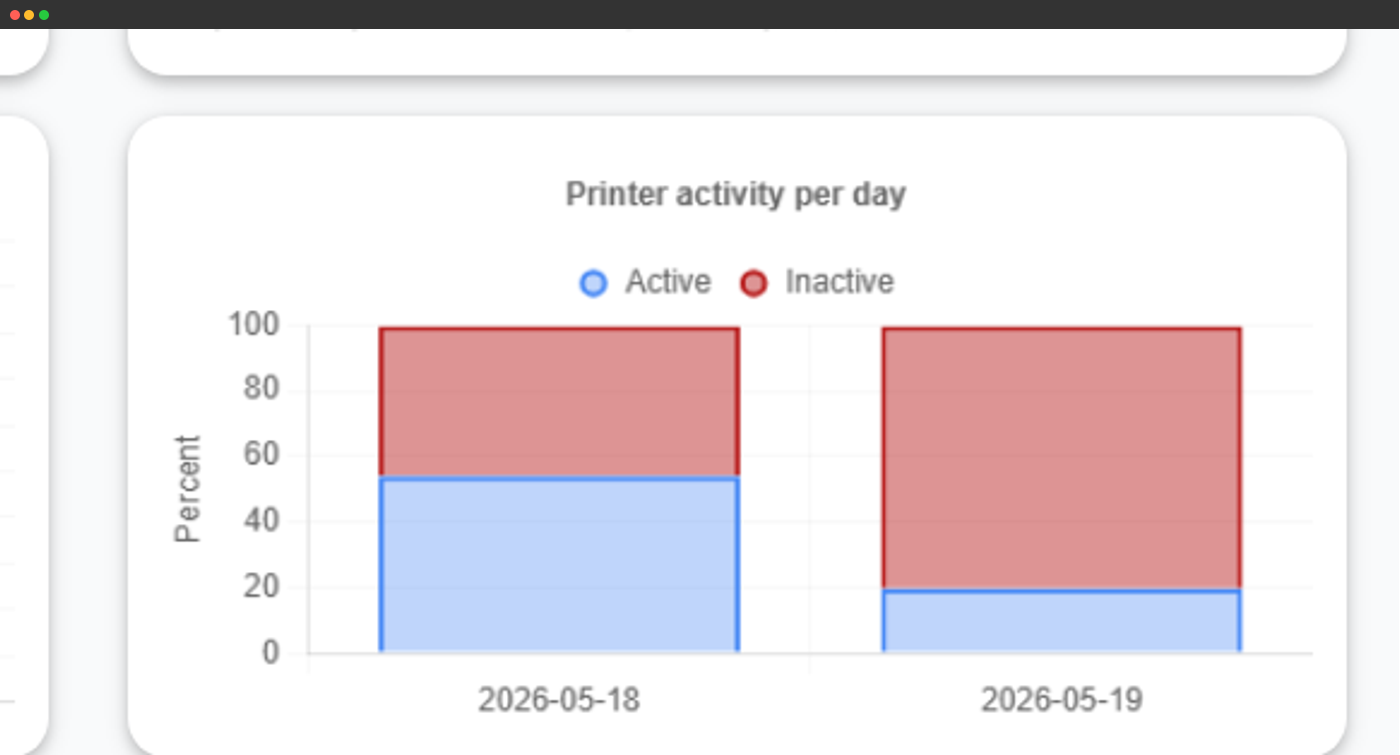
Active vs inactive time per day across your fleet.
The filament chart is also a reorder forecaster
The filament usage chart doubles as a reorder forecaster - last 90 days of consumption per material maps cleanly to next 90 days of procurement. Print farms use it to size monthly PLA / PETG / ASA buys without spreadsheets; schools use it to plan the next semester's filament budget.
Slice the data the way your team actually thinks
The filter bar at the top of the page controls every card and every chart. Switch between a quick preset window or pick exact dates, then narrow by printer, by printer model or by user - the rest of the page just follows.
Preset windows
Today, past 7 days, past month or all-time.
Exact date range
Pick start and end dates for any report period.
Printers and models
Scope every chart to one printer, a model family or a group.
Per-user filtering
Admins can drill into one user or a few at a time.
Two views, the same page: yours, and everyone's
Statistics respects how your account is structured. On a single-user account you just see your own data. On an account with multiple users, admins with view organization-wide statistics permission see the whole account by default and can drill into individual users; everyone else sees only their own prints.
That means a workshop manager can audit the fleet, a teacher can grade a class, and individual students or operators still get useful personal stats - all from the same page, with the same charts, gated by permission rather than by feature.
Export the raw data when you need it elsewhere
Numbers on a page are great for at-a-glance. Sometimes you need them in a spreadsheet - for accounting, for procurement, for a customer quote, or for a custom dashboard. Hit Export and the current filtered dataset downloads as a CSV with summary cards, per-day rows and per-printer rows in one file.
CSV export is included on the Print Farm, School and Enterprise plans - the plans where exporting numbers actually matters.
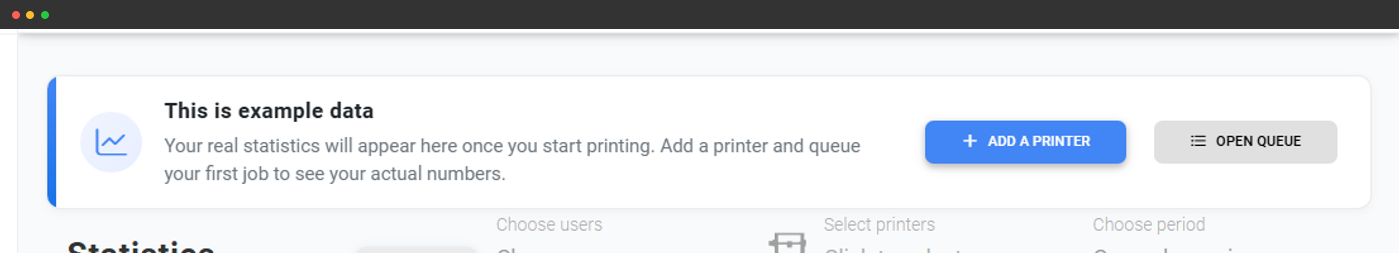
See what it looks like before you have a single print
New accounts don't have any print history yet - but the statistics page still has something to show. If your account has access to statistics but no prints recorded, it fills the page with realistic example data and a clear banner telling you so. Add your first printer, queue a job, and the example data is replaced by your real numbers as soon as they start rolling in.
Your data, kept for as long as your account exists
Print history isn't auto-deleted, and statistics never expire. The general overview window goes back to the day you created your account, so even years-old prints are still visible, comparable and exportable. Cancel a print today, look at it in three years - it's still there.
Powered by everything else SimplyPrint already tracks
Statistics aren't a separate system - they're what naturally falls out of the rest of the platform doing its job. Every print job that runs through SimplyPrint contributes its outcome, its duration, its filament use and its cost. The AI failure detection reports money saved. The filament manager sources material weight. Per-print cost calculation sources currency. Custom cancel reasons feed the cancel reasons chart.
You don't need to configure anything to get useful statistics - you just need to use the rest of SimplyPrint. The data shows up.
The same data powers usage-based maintenance scheduling
Statistics is the front-end of a data pipeline that keeps your fleet from breaking down
Statistics aren't just a dashboard - they're the data layer underneath the printer maintenance feature. Every print job logged here updates per-printer counters: print hours, filament grams and print count since last service. Maintenance schedules read those counters once an hour and create work orders the moment a printer crosses your threshold ("every 200 print hours", "every 5 kg of filament", "every 100 prints") - no spreadsheets, no calendar reminders. A built-in moving-average predictor uses each printer's recent daily usage to create jobs before they're due, so your team can plan instead of react.
If you're already running SimplyPrint, the statistics page is the visible front-end of a pipeline that's quietly keeping your fleet from breaking down.
Plan access: what's required for statistics?
The statistics page itself is included on Pro and above; CSV export of the underlying dataset is included on Print Farm and above.
| Feature / Limit | Free | Basic | Pro | Print Farm | Enterprise | School | Cloud Slicer | Filament Manager |
|---|---|---|---|---|---|---|---|---|
|
Statistics page
Summary cards, every chart, the full filter bar and the demo data fallback. Available on Pro, Print Farm, School and Enterprise.
|
||||||||
|
CSV export
Download the current filtered dataset as a CSV with cards, per-day rows and per-printer rows. Available on Print Farm, School and Enterprise.
|
||||||||
|
Per-user filter
Required for the multi-user view and per-user filtering. Available on Print Farm, School and Enterprise.
|
Want to learn more about our plans?
View full pricing & feature comparison